
Like our previous post on Python, we will walk through all the really nice offerings Visual Studio gives us now when working with R and related tools.
Since we looked at installing in the previous post, and the steps are the same, I will omit that from this post. We’ll just focus on all the awesome R tools Visual Studio provides for you.
R Projects
Similar to Python, when we installed the data science tools we get an “R” section in our templates. If you go there you’ll see something like this:

Only one template to choose from, but that’s ok! That is all we need.
R Interactive
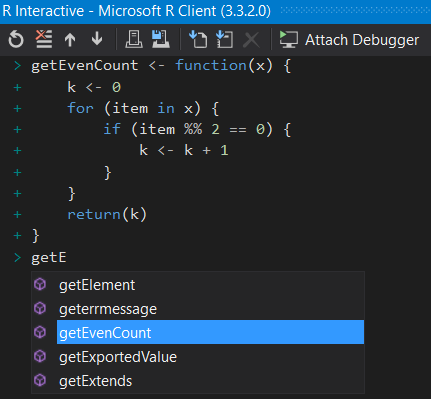
Just like there’s a Python Interactive, there’s also an R Interactive window. It acts very similar to the Python Interactive, as well. Just highlight or put your cursor on the line in a script you want to send to the interactive and hit Ctrl+Enter. Of course, you can just type directly into the interactive to get some quick result or feedback on a piece of code. Oh, and there is syntax highlighting and intellisense right in the interactive!
Running R Code
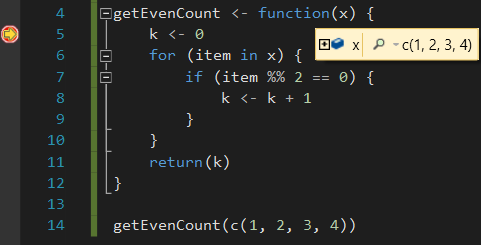
Like all applications in Visual Studio, just hitting the green “Run” button will execute your code. And, just like with Python, you can set a breakpoint in your R code and debug through it.
Visualizations
Having R support in Visual Studio wouldn’t be useful if it didn’t support visualizations. Similar to RStudio, Visual Studio has a tab that’s used to display plots.
Luckily, R comes provided with quite a few sample data sets. To list them all just type in data(). Let’s look at a dataset called JohnsonJohnson, which is quarterly earning of Johnson & Johnson from around 1960 to 1980. Let’s use a scatterplot that also adds a curve.
scatter.smooth(JohnsonJohnson)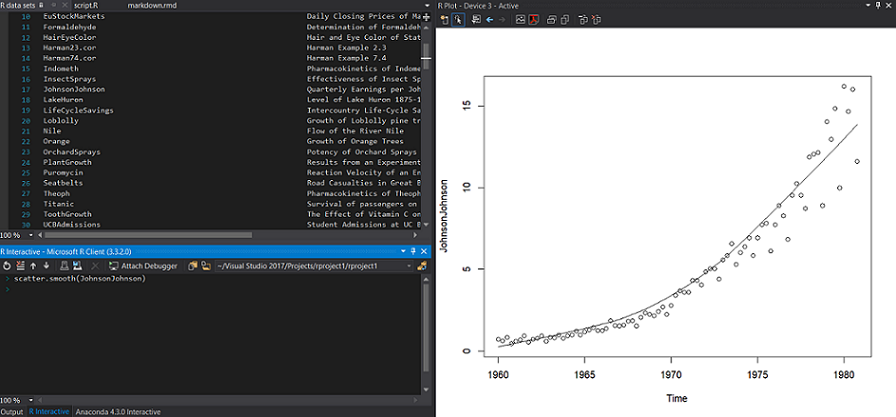
Pretty nice for just a small line of code! You can imagine how much more complicated the visualizations can get just by adding a bit more code.
R Markdown
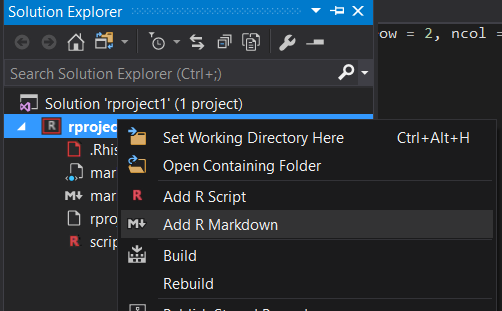
R has a really nice feature to help distribution code, text, and visualizations with R Markdown. Pretty similar to Python’s Jupyter Notebooks, it also features a way to output to different formats, such as PDF and HTML. Visual Studio also has support for this, though it takes a little bit to set up. Microsoft has a nice documentation page that details all that you need to do. Now you can create R Markdown files in Visual Studio!
While you can output your R Markdown document in HTML, PDF, and Word, RStudio has a few more ways you can. It allows you to also output as an actual web site or a scientific article. Hopefully, Visual Studio can provide most of the other output types fairly soon.
Shiny Apps
One of the things I have a hard time trying to find are ways to deploy your models. Sure you can have everything local, but what’s good about that if no one else can see or use it? Well, the same team who brought us RStudio also has a very compelling feature for R to share your findings – Shiny. This framework allows you to create web applications to share your findings and, even better, to share your models for anyone to interact with. They also supply hosting for your web applications, so they have all that you need to get your findings and models out to the world.
Unfortunately, Visual Studio doesn’t support Shiny. Although, I really hope they will integrate better support for Azure in order to deploy web services that will call into our models and host web applications that use those web services.
Like Python, R in Visual Studio still has a few things it can improve on. But once it does, I feel Visual Studio can be a really good contender for RStudio in the future.